
Page 112 - PT Kilang Pertamina Balikpapan
P. 112
107
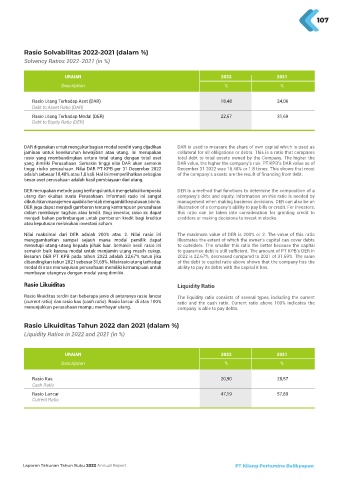
rasio Solvabilitas 2022-2021 (dalam %)
Solvency Ratios 2022-2021 (in %)
URAIAN 2022 2021
Description % %
rasio utang terhadap aset (Dar) 18,48 24,06
Debt to Asset Ratio (DAR)
rasio utang terhadap modal (DEr) 22,67 31,69
Debt to Equity Ratio (DER)
Dar digunakan untuk mengukur bagian modal sendiri yang dijadikan Dar is used to measure the share of own capital which is used as
jaminan untuk keseluruhan kewajiban atau utang. ini merupakan collateral for all obligations or debts. this is a ratio that compares
rasio yang membandingkan antara total utang dengan total aset total debt to total assets owned by the Company. the higher the
yang dimiliki Perusahaan. semakin tinggi nilai Dar akan semakin Dar value, the higher the company’s risk. Pt kPB’s Dar value as of
tinggi risiko perusahaan. Nilai Dar Pt kPB per 31 Desember 2022 December 31 2022 was 18.48% or 1.8 times. this shows that most
adalah sebesar 18,48% atau 1,8 kali. Hal ini memperlihatkan sebagian of the company’s assets are the result of financing from debt.
besar aset perusahaan adalah hasil pembiayaan dari utang.
DEr merupakan metode yang berfungsi untuk mengetahui komposisi DEr is a method that functions to determine the composition of a
utang dan ekuitas suatu Perusahaan. informasi rasio ini sangat company’s debt and equity. Information on this ratio is needed by
dibutuhkan manajemen apabila hendak mengambil keputusan bisnis. management when making business decisions. DEr can also be an
DEr juga dapat menjadi gambaran tentang kemampuan perusahaan illustration of a company’s ability to pay bills or credit. For investors,
dalam membayar tagihan atau kredit. Bagi investor, rasio ini dapat this ratio can be taken into consideration for granting credit to
menjadi bahan pertimbangan untuk pemberian kredit bagi kreditur creditors or making decisions to invest in stocks.
atau keputusan melakukan investasi saham.
Nilai maksimal dari DEr adalah 200% atau 2. Nilai rasio ini the maximum value of DEr is 200% or 2. the value of this ratio
menggambarkan sampai sejauh mana modal pemilik dapat illustrates the extent of which the owner’s capital can cover debts
menutupi utang-utang kepada pihak luar. semakin kecil rasio ini to outsiders. the smaller this ratio the better because the capital
semakin baik karena modal untuk menjamin utang masih cukup. to guarantee debt is still sufficient. The amount of PT KPB’s DER in
Besaran DEr Pt kPB pada tahun 2022 adalah 22,67% turun jika 2022 is 22.67%, decreased compared to 2021 of 31.69%. the value
dibandingkan tahun 2021 sebesar 31,69%. Nilai rasio utang terhadap of the debt to capital ratio above shows that the company has the
modal di atas menunjukan perusahaan memiliki kemampuan untuk ability to pay its debts with the capital it has.
membayar utangnya dengan modal yang dimiliki.
Rasio Likuiditas Liquidity Ratio
rasio likuiditas terdiri dari beberapa jenis di antaranya rasio lancar The liquidity ratio consists of several types, including the current
(current ratio) dan rasio kas (cash ratio). rasio lancar di atas 100% ratio and the cash ratio. Current ratio above 100% indicates the
menunjukkan perusahaan mampu membayar utang. company is able to pay debts.
rasio Likuiditas tahun 2022 dan 2021 (dalam %)
Liquidity Ratios in 2022 and 2021 (in %)
URAIAN 2022 2021
Description % %
rasio kas 20,90 28,57
Cash Ratio
rasio Lancar 47,19 57,89
Current Ratio
Laporan Tahunan Tahun Buku 2022 Annual Report PT Kilang Pertamina Balikpapan